
Motivation
Drift Detection is an important aspect for monitoring the health of deployed models. This article helps summarizes my learnings and intuitions from my internship project at AI Research Labs in Persistent around drift detection.
The need of the project was to put an MLOps pipeline with a demo-able use case serving as Proof Of Concept for drift monitoring. However, we did not have good data on which drift could be demonstrated. The goal of the project was to evaluate public datasets to demonstrate drift and also generate a synthetic dataset for the demonstration. This article summarizes my work on generating synthetic datasets.
Target audience and takeaways
This blog is for every data science enthusiast who is willing to understand the problem of data and concept drift in a better way. The only prerequisite for this blog is that the reader must have a basic understanding of what data and concept drift is. A quick definition for these terms could be –
Data Drift (also called feature, population, or covariate drift) happens when there is a change in the distribution of data in train and test sets. These changes can occur due to changes in the real world or changes in the measure.
Concept Drift occurs when the patterns the model learned no longer hold. That is, the relationship itself between the independent variable and dependent variable gets changed. It can be further classified based on the duration and time of drift as – gradual, sudden or recurring.
Reading this blog will make your drift-related concepts better through some observations on a real-world dataset. You will understand how to detect if any dataset is facing the problem of data and concept drift or not. If yes, then what are the consequences of these drifts, and how each one of them can affect our overall model in different circumstances.
Datasets
Before starting off with creating the model and showing drifts and their impact on the model, I had to choose few dataset suited best for this purpose. After going through 27 different datasets, I finally chose two real-world datasets – Australian Electricity Market Dataset and Analytics Vidhya Loan Prediction Dataset. My main work is on the Loan Prediction Dataset, but to get started I will begin with the Australian Electricity Model.
Australian Electricity Market Model
I have used this model to show Concept Drift. This model uses the data collected from the Australian New South Wales Electricity Market, where the electricity prices are not stationary and are affected by the market supply and demand. The prediction target of the model is whether the prices will go UP or DOWN. Each example of the dataset refers to a period of 30 minutes and thus there are 48 instances of each day. Below are some important attributes of the dataset –
Table 1: New South Wales Electricity Market Dataset Details
| Prediction Target | Prices go UP vs DOWN |
| Timestamp | Date between 7 May 1996 to 5 Dec 1998. Here normalized between 0 & 1 |
| Categorical Features | 1 — {“day”} |
| Numerical Features | 7 — {“date”, “period”, “nswprice”, “nswdemand”, “vicprice”, “vicdemand”, “transfer”} |
| Target Column | Categorical [0/1] |
| Total Size | 45000 |
| Accuracy | 85% |
You can find the dataset and further details about each feature.
Now, it was time to show Concept Drift. Since, there was no specific point after which we can say that the drift has started, I used the idea of dependence of electricity demand on season and festivals as the basis for split.
I created two models out of this dataset. I trained the first model on the winter days of 1996 and tested on the winter days of 1997. Whereas I trained the second model on the winter days of 1996 and 1997 and tested on the summer days of 1997. Since, the date column was normalized between 0 and 1, I used some basic maths to find the exact row numbers for splitting the dataset. Finally, I generated a Classification Performance Report with the help of an open-source library evidently.ai, to compare the performance of these two models.
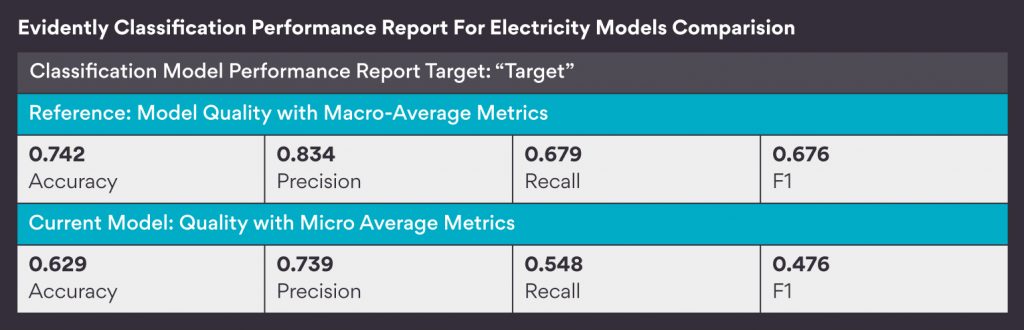
*For keeping this blog concise – we would consider model accuracy as the sole measure for the model performance.
We can clearly see that the difference in the model performance is more than 11%. This indicates that seasonality has affected the model and thus the model is facing the problem of Reoccuring Concept Drift.
You can find the complete code and report files from the GitHub link provided at the end.
Loan Prediction Model
This was the model on which I spent majority of my time and came with some interesting observations. I created a Random Forest Model with this dataset, which predicts whether a customer’s loan request be rejected or accepted based on the details provided in the application form. You can see few essential attributes of the dataset below –
Table 2: Loan Prediction Dataset Details
| Prediction Target | Approve Vs. Reject Loan. |
| Categorical features | #8 — {“Gender”, “Married”, “Dependents”, “Education”, “Self_Employed”, “Property_Area”, “Credit_History”, “Loan_Amount_Term”} |
| Numerical features | #3 — {“ApplicantIncome”, “CoapplicantIncome”, “LoanAmount”} |
| Target Column | Categorical [0/1] |
| Training/Testing Size | 614/367 |
| Accuracy | Around 80% |
You can find the dataset and further details about each feature from here.
Data Drift
I started with data drift. To create data drift in the model, I took the training data and split it into two unequal parts. I kept the first part as it is, and for the second part, I changed the distribution of three features – “ApplicantIncome,” “CoapplicantIncome,” and “LoanAmount.” For changing the distribution, I created a new dataset as a copy of the second part and made these changes in it –
- For each row of the second part:
- Changed ApplicantIncome by a random percentage between (-60, -20)
- Changed CoapplicantIncome by a random percentage between (-60, -20)
- Changed LoanAmount by a random percentage between (30, 70)
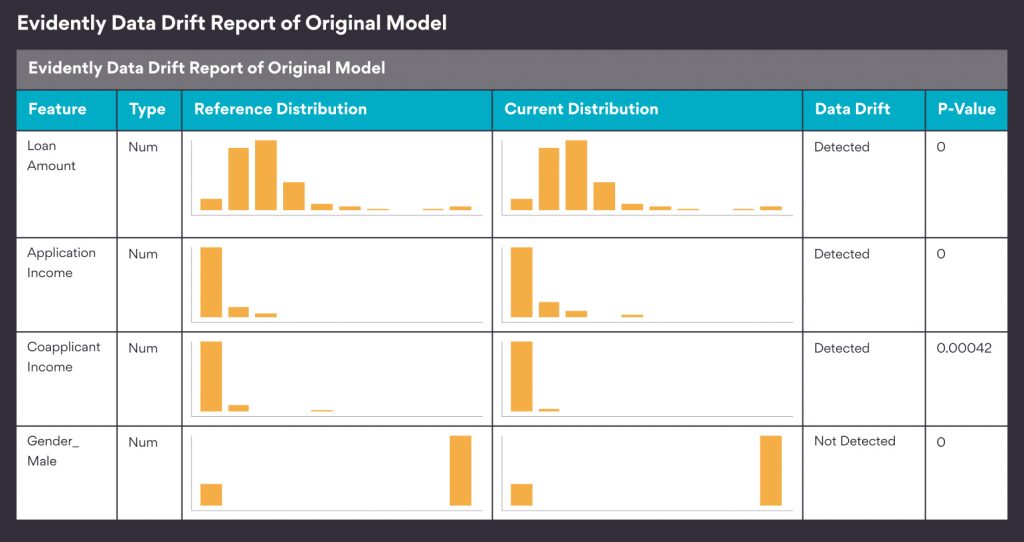
To confirm that the following changes have introduced data drift in the dataset, I generated a Data Drift report, again through Evidently. The statistical test that evidently uses to detect data drift is – Kolmogorov-Smirnov test for numerical features and Chi-Squared test for categorical features, each with 95% confidence level.
Next, I checked how the model predictions get affected because of this data drift. For this, I generated a Classification Performance Report through evidently.ai. The report compares model performance on the original testing dataset with that on the data drift induced dataset through different metrics, confusion matrix, etc.
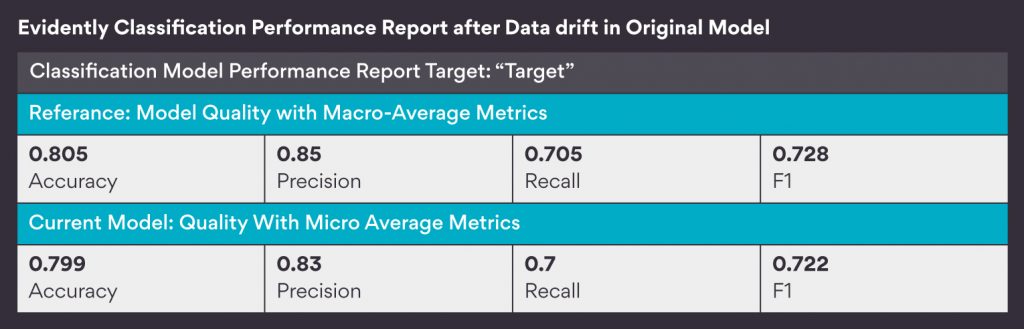
But the results are shocking, isn’t it? The report shows that the model performance has hardly deteriorated. What is the reason behind such a small change? Does this mean that we can generalize that the data drift does not affect model performance for any model?
After brainstorming and trying different ranges of random percentage changes for more than two hours, I realized that more than 50% weightage of the model prediction actually depends on a single feature which is “Credit_History.” And thus, changing these three features would not cause any significant changes in the prediction as they just make about 20% of the total weightage.
Data Drift In New Model
To check if data drift ever reduces model performance, I changed the model a little bit. As previously, the feature “Credit_History” dominated the model. I created a new model with the same dataset, excluding the feature “Credit_History.” This increased the combined weightage of the three features as discussed above from 20% to 60%. Next, I repeated the same procedure as above for this new model – made similar changes in those three features, generated a Data Drift Report and Categorical Performance Report. The result was –
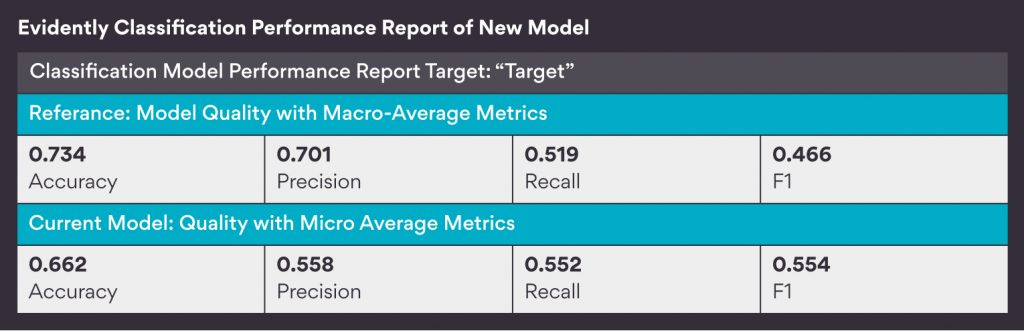
Here, you can see that this time the model performance got significantly reduced from 73% to 66%, i.e., around 7%. In actuality, it was reduced from 2-11% depending on the random values assigned for each run. That is why for this blog, I took the report, which was showing around mean results.
This was all about the synthetic datasets I created for the data drift part. Along with these, I even made a function in my model that detects any data drift in the new incoming data. This part is just to show my extra works and has no relation with the story going on till now, so you can directly jump to the Concept Drift part if you are not interested in this.
Function To Detect Data Drift On New Data:
Input: JSON file with feature values
Processing: JSON file → Python Dictionary → Python DataFrame (until fixed batch-size inputs) → Some feature engineering → Generating separate reports for drifts in numerical data (KS-Algorithm) and categorical data (Chi-Squared Algorithm) using an open-source library alibi-detect
Output: Drift detection report
*You can find the complete code with all the required associated files to run the function in the Jupyter Notebook shared at the end of the blog.
Concept Drift
Now, it is time for the Concept drift. To create concept drift in our model, I used the testing data and changed values for a few of the features keeping the rest the same. Since we do not know the ground truth values for this new dataset, I assigned ground-truth values to each row through some predefined thresholds. Below are the changes that I have made, followed by the intuition behind making such changes.
Changes in feature –
- Changed “ApplicantIncome” and “CoapplicantIncome” by a random percentage between -20 to 10.
- Increased “LoanAmount” by a random percentage between 20 to 50.
- Assigned random number 0 or 1 to Credit_History for rows which had (Credit_History=1 & LoanAmount_Change > 25 & (ApplicantIncome_Change or CoapplicantIncome_Change) < 0).
The intuition behind making these changes is –
- These changes are made keeping covid time in mind.
- Many people lost their job or got wage cuts.
- Unexpected substantial medical expenses for many.
- Rise in the inflation rate.
- Business losses.
- Combining these effects, changes in Income and Loan Amounts are made.
- The model was not reacting much to changes in Income and Loan Amount only as more than 50% output prediction depends on Credit_History.
- For a few of the people who got their income reduced and loan requirement increased, they may not have been able to repay their past loans on time, and thus their credit history might have been affected.
- Taking the above point into consideration, changes in Credit_History are made.
As mentioned before, to give ground-truth values to a new dataset, I created a function with some predefined threshold conditions using some logic.
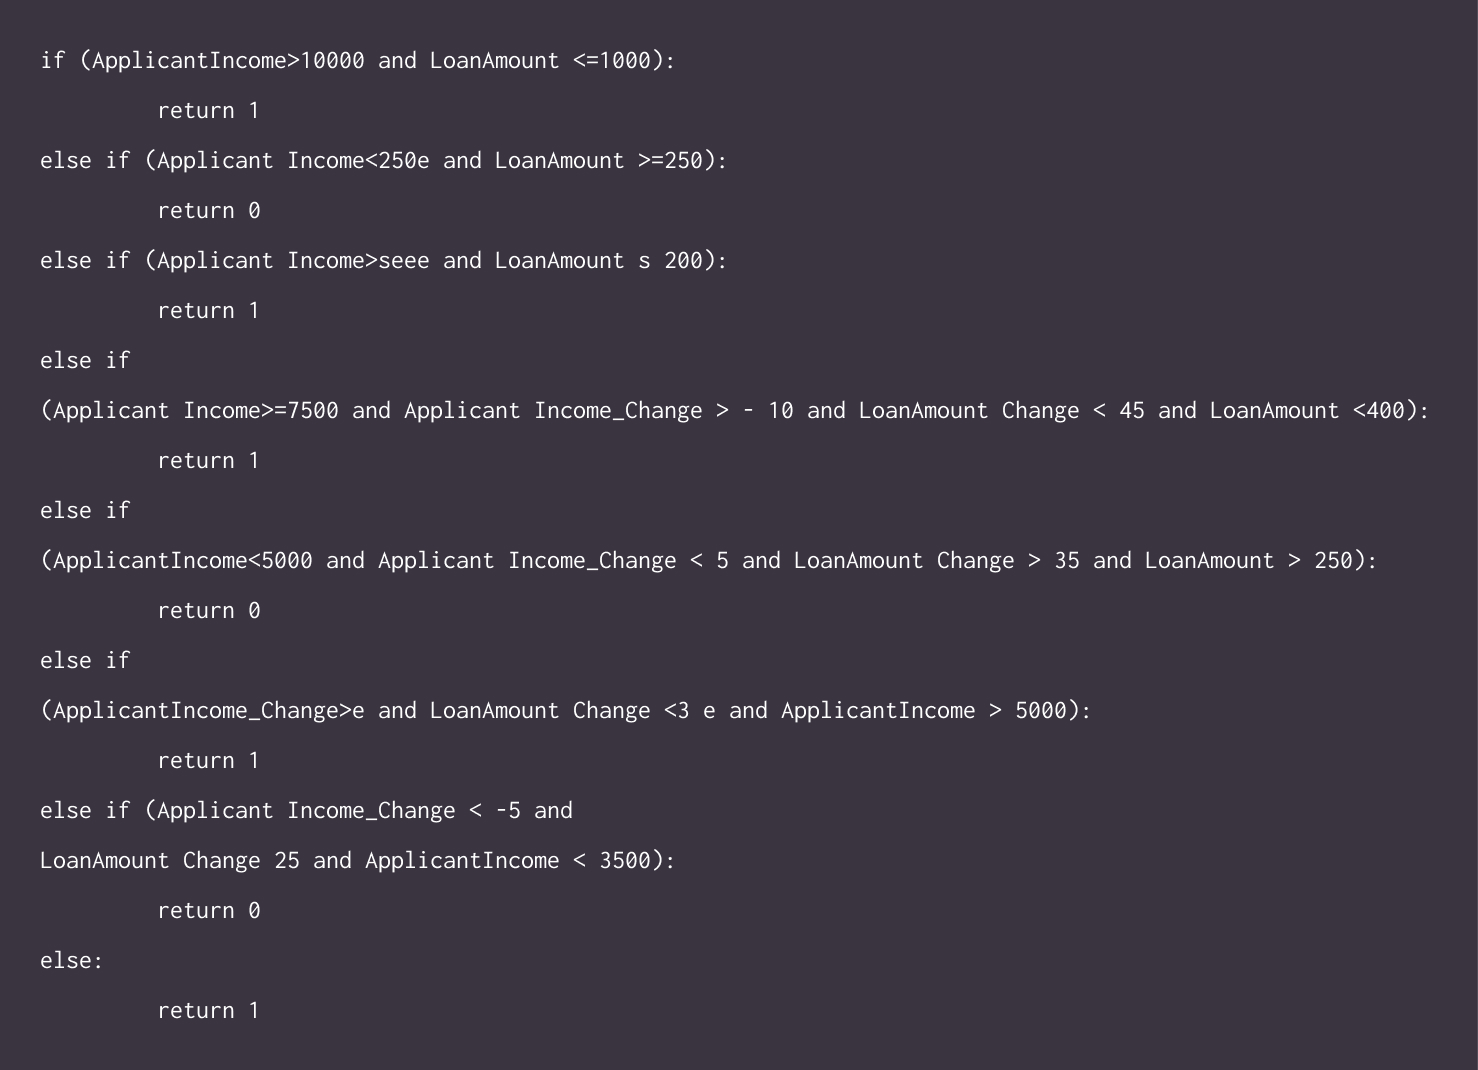
Finally, after doing all these things, I generated a Classification Performance report to compare the model performance on the original dataset and this new synthetically generated dataset.
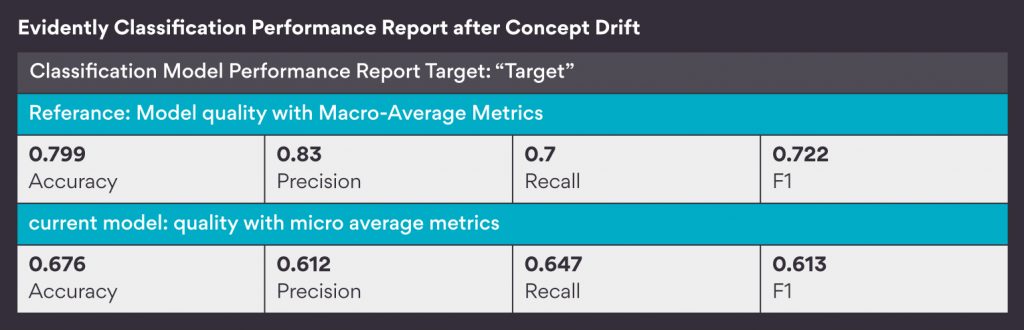
We can see that the model performance has drastically reduced from 80% to 67.6%, which indicates that the model is surely unable to perform the same on this sudden concept drift induced new dataset.
What might have happened in real-scenario
The big picture that we can make out of these observations is that – during the covid times, due to several factors, there was a data drift in three of the model features. But the model was able to absorb these changes and was still able to perform pretty well. With time, due to a decline in income and rise in expenses, this data drift slowly led to concept drift, and thus the model started struggling hard to predict the same way.
Summary and Conclusion
This blog helps provide insights into how to detect data and concept drift and how these drifts affect the model in different situations. First we saw how I used the dependence of electricity demand on season as the basis to depict reoccurring Concept Drift. Next we saw three different instances in the Loan Prediction Model. First, there was data drift but no drop in accuracy; second, there was data drift with a decline in accuracy; and third, when there was concept drift with a significant drop in accuracy and thus required model retraining.
After going through all these observations we can say that it is not for sure that data drift would lead to a decline in model accuracy. One should first see how important each feature is for the model prediction. If there is a data drift in a relatively less important feature, it might not affect the model performance significantly in the short run. But there is also a possibility that with time these changes start affecting other features and thus the overall model as well. This can surely affect model performance significantly.
At Persistent, we are helping our Customers build Responsible AI systems that focus on transparency and reproducibility. These MLOps pipelines can understand the production performance of ML models for our Customers in Health Care and Banking & Finance Industries. To learn more about Persistent’s Artificial Intelligence & Machine Learning offerings, connect with us at: airesearch@persistent.com.
You can see the complete code in Jupyter Notebook or Python from here.