
Observability plays a crucial role in software development and system operations, ensuring that engineers have a comprehensive understanding of the workings of complex systems. Unlike traditional Monitoring, which primarily focuses on measuring predefined metrics and detecting issues, Observability emphasizes understanding system behavior through diverse data sources and actionable insights.
In this blog, we will delve deeper into the components of an Observability solution, exploring how each tech component enhances visibility and enables proactive Monitoring and troubleshooting. By examining each component in detail, we aim to provide a comprehensive understanding of our Observability stack and its impact on ensuring the reliability and performance of systems.
What is Observability:
Observability is the process of collecting data from various endpoints and services to measure a system’s internal state. It comes from aggregating and correlating the telemetry data (logs, metrics, and traces) coming from:
- Hardware
- Software
- Cloud infrastructure components, like containers
- Open-source tool
- Microservices
This instrumented data is then sent to the Observability backend for analysis.
How Observability Differs from Monitoring:
Although Observability and Monitoring are used interchangeably, there is a notable difference between them. While Monitoring typically involves tracking metrics such as CPU usage, memory consumption, and network traffic, Observability extends beyond these surface-level indicators. It emphasizes capturing detailed telemetry data, including logs, traces, and metrics, to provide a holistic view of system performance and behavior. Monitoring tends to be more reactive, while Observability enables proactive problem-solving by facilitating deeper insights into system dynamics and facilitating root cause analysis.
OpenTelemetry
OpenTelemetry is an open-source Observability framework that standardizes the collection and analysis of telemetry data such as traces, metrics and logs across diverse software environments. It provides a unified approach to Observability by supporting multiple programming languages, frameworks, and platforms.
It is vendor and tool-agnostic and can be easily used with Observability backends such as Jaeger, Prometheus and other commercial offerings. OpenTelemetry helps to instrument applications or systems regardless of their language, infrastructure, or runtime environment.
Magnify – Persistent’s Observability Solution:
At Persistent Systems, Observability is a top priority, and we have built a comprehensive solution called – Magnify – around OpenTelemetry and other open-source technologies to offer visibility into an organization’s systems operations.
Solution Architecture:
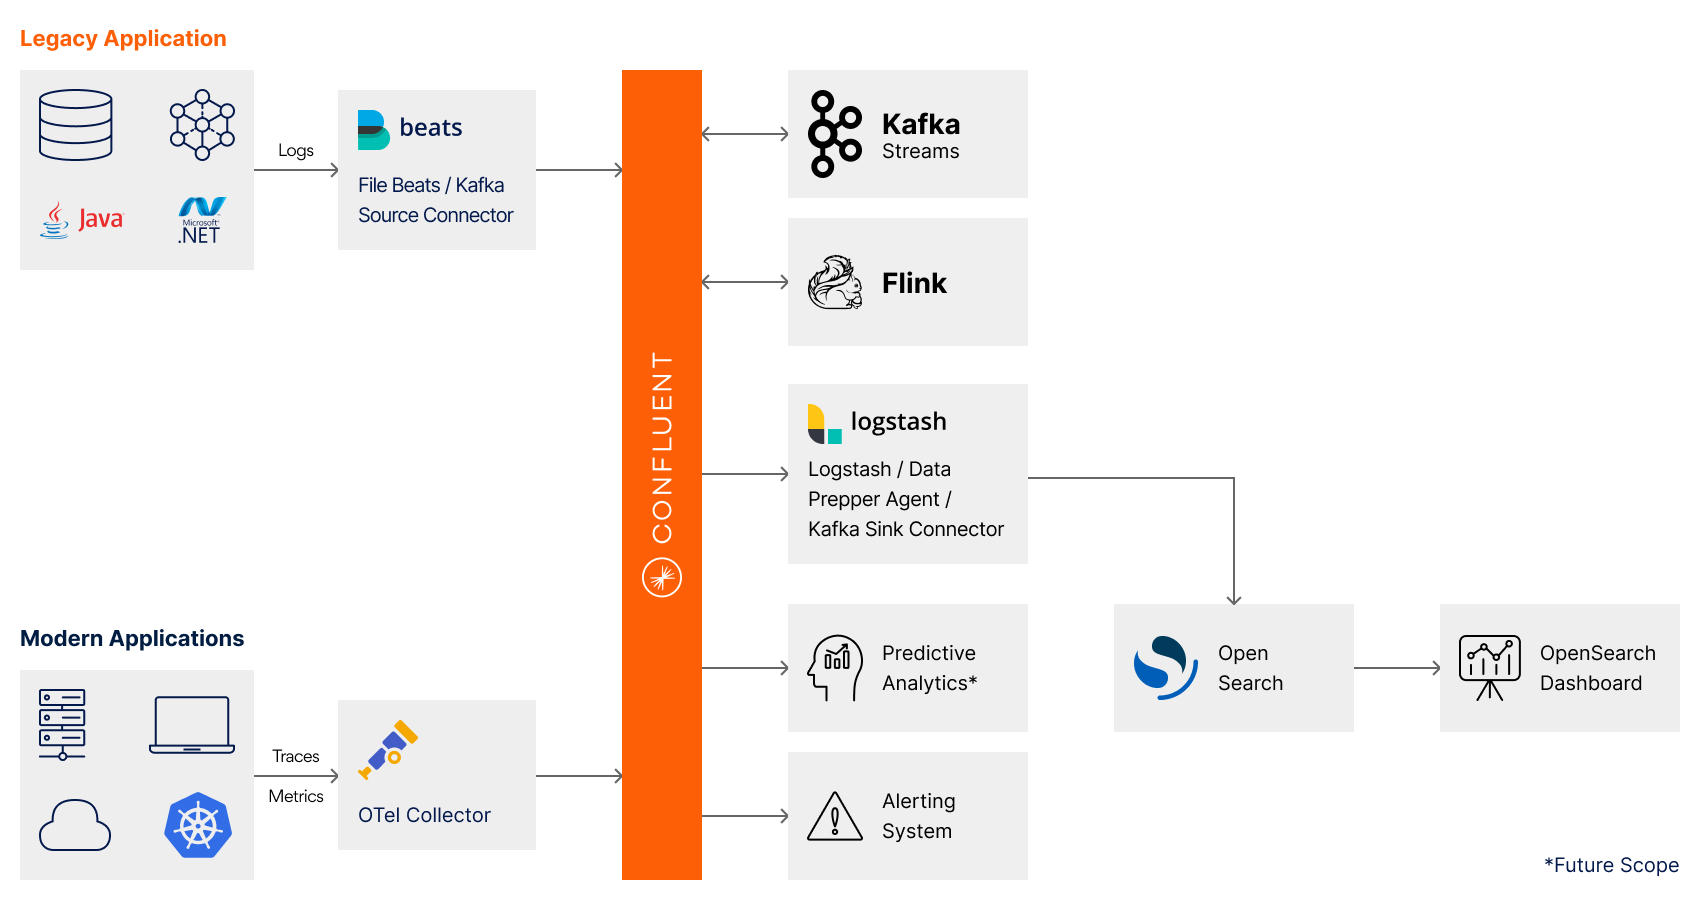
This solution includes various open-source components like OpenSearch, LogStash, OTel Collector, Kafka, Kafka Streams, and Flink. These components are explained in detail below.
Beats:
Beats are installed agents to ship different kinds of data. For example, Winlogbeat ships Windows event logs, Metric Beat ships host metrics and FileBeat ships log files.
LogStash:
Ingests, aggregates and transforms traditional logs from different applications. The transformed data is published to Kafka using Logstash Kafka output plugin.
OTelCollector:
Receives, processes and exports logs from applications generated using the OTel API/SDK. The Kafka exporter is used to export logs to Kafka.
Kafka:
Serves as the central hub for streaming data. File Beats and OTel Collector send their data to Kafka topics.
Flink:
Performs complex event processing, windowing, and stateful computations on the real-time and batch data. It generates new events for anomaly detection and Predictive analytics.
Kafka Streams:
Performs complex event processing, windowing, and stateful computations on the log data received from Kafka in real time. This will help for real-time event stream processing where data is on Kafka only.
OpenSearch:
OpenSearch is a distributed search and analytics engine based on Apache Lucene. Full Text Search could be performed once the data is loaded. Other possibilities include search by field, search multiple indexes, boost fields, rank results by score, sort results by field, and aggregate results which will be used heavily in this solution.
OpenSearch Dashboard:
OpenSearch Dashboards offers a comprehensive and integrated solution to visually explore, discover, and query your Observability data.
Alerting System:
This is a small custom component responsible for sending alerts to users via Email or SMS, or some other messaging format. This component will receive a notification from Flink for the alerts to be generated.
Predictive Analytics:
This component analyzes historical data and real-time feed to generate early warnings for potential anomalies or breakdowns. It uses Predictive AI to generate warnings that can be used to take preventive action and avoid service disruption.
By leveraging these technologies combined with OpenTelemetry, our robust Observability solution Magnify provides us with deep insights into systems’ operations, enabling us to detect anomalies and ensure optimal performance and reliability. This holistic approach to Observability reinforces our commitment to delivering high-quality software and services to our customers.
Solution Differentiators:
- One comprehensive solution for complete Observability requirements
- Fully extensible design
- Scalable solution due to use of components like Kafka, Open Search
- Based on Open Standard like OpenTelemetry
- Ability to include Hardware components under Observability framework.
- Ready for Hybrid Infrastructure (Public Cloud, Private Cloud, OnPrem)
- Ability to use AI for Predictive Analytics and pre-emptive alerting.
Future Direction:
Magnify is a fully extensible platform built for customers seeking a comprehensive Observability stack for their IT infrastructure. All the components included in the solution are open-source products; however, equivalent commercial products such as Confluent Kafka, Confluent Kafka Connectors, Elastic, etc. can also be used.
At Persistent, we are dedicated to empowering our clients with cutting-edge tools and technologies that will help them achieve exceptional levels of Observability and operational excellence. Looking ahead, we are committed to continuously enhancing and evolving Magnify to meet the evolving needs of our clients and the challenges of modern software development and operations. Our near-future vision is to integrate advanced Machine Learning (ML) and AI-driven analytics to enable predictive insights, automate anomaly detection, and reduce resolution time.
Explore our integration services.
Author’s Profile

Ajit Mahajan
Solutions Head, Integration Practice

Dr. Ravi Tomar
Senior Architect, Integration Practice